Romain Francois, Professional R Enthusiast

To content | To menu | To search

Tag - graphgallery

Entries feed - Comments feed

Monday, February 18 2013

Improving the graph gallery


I'm trying to make improvements to the R Graph Gallery, I'm looking for suggestions from users of the website.

I've started a question on the website's facebook page. Please take a few seconds to vote to existing improvements possibilities and perhaps offer some of your own ideas.


graph-gallery.png

Thursday, June 3 2010

graph gallery collage

It does not quite respect the one color only requirements of the mango's t-shirt contest, but I played with Shape Collage and the graphics from the graph gallery to make this collage.jpg

Wednesday, September 23 2009

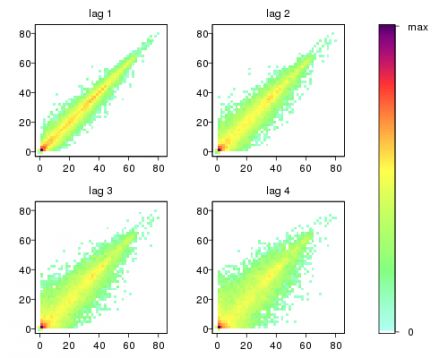
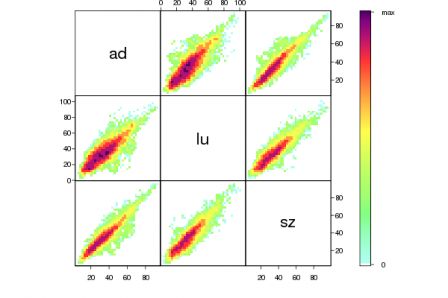
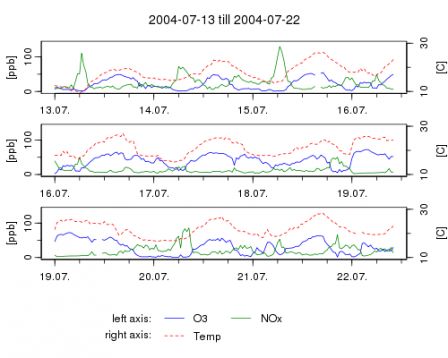
RGG #158:161: examples of package IDPmisc

three new graphs have made their way to the graph gallery, submitted by Reto Burgin

Image lag plot matrix

graph_158.png

Image scatter plot matrix

graph_159.png

Regular time series

graph_160.png

Tuesday, September 8 2009

search the graph gallery from R

This is a short code snippet that is motivated by this thread on r-help yesterday. The gallery contains a search engine textbox (top-right) that can be used to search for content in the website using either its internal crude search engine or perform a google search restricted to the gallery.

Here we write a small R function that can be used to take advantage of the search engine, from R

rgg.search <- function( topic, engine = c("Google", "RGG") ){

    engine <- match.arg( engine )
    url <- URLencode( sprintf( "http://addictedtor.free.fr/graphiques/search.php?q=%s&engine=%s", topic, engine ) )
    browseURL( url )
}
rgg.search( "Andrews plot" ) 

Tuesday, July 21 2009

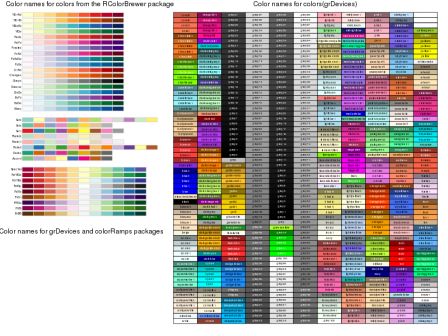
RGG#155, 156 and 157

I pushed 3 more graphics from Biecek Przemyslaw to the graphics gallery

A list of popular names for colors from packages RColorBrewer, colorRamps, grDevices

graph_155.png

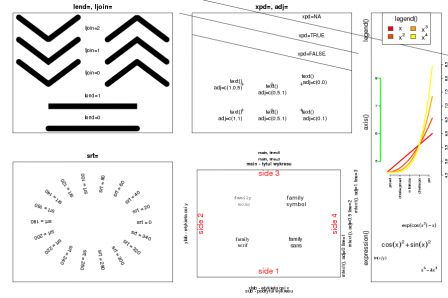
A set of examples of few graphical low-level parameters lend, ljoin, xpd, adj, legend(), axis, expressions, mtext, srt etc

graph_156.png

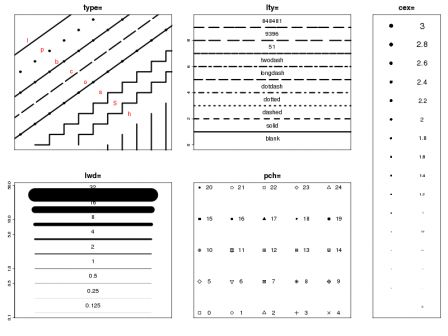
Examples for different settings of:

  • the type and width for lines
  • and the type and size for points

graph_157.png

Wednesday, July 8 2009

RGG# 154: demo of atomic functions

Przemyslaw Biecek has submitted this graph (and also others I will add later) to the graphics gallery

graph_154.png

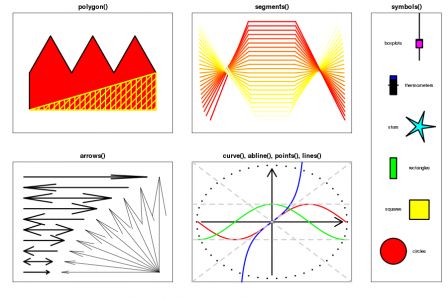
A list of examples for the atomic functions polygon(), segments(), symbols(), arrows(), curve(), abline(), points(), lines(). this figure is taken from the book Przewodnik po pakiecie R

Friday, July 3 2009

RGG#153: stars network

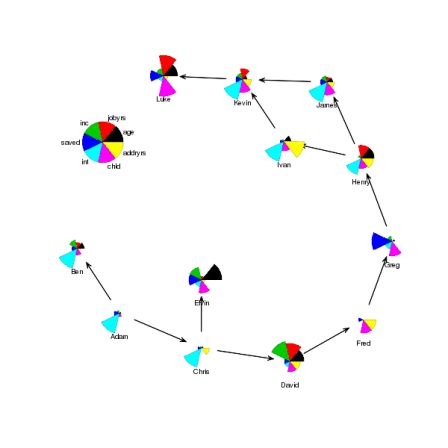
Graham Williams sent me this graph, now item 153 in the graph gallery.

graph_153.png

This plot draws a network but at the nodes we have simple segment plots (and in general we might have any other kind of plot at the nodes). This code constructs a network (from the network package), plots it with the nodes being invisibly plotted (using plot.network from the sna package) and then overlays the segment plots using the star function (with the key being located at a position determined by largest.empty from the Hmisc package.

Thursday, March 26 2009

update on RGG#152

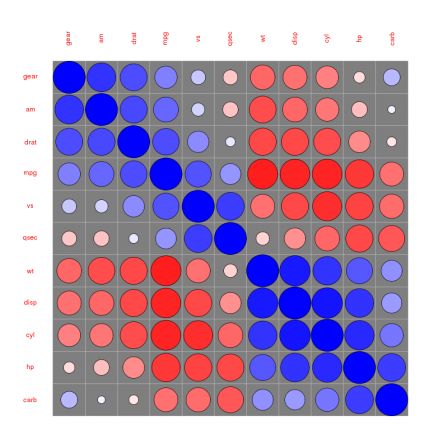
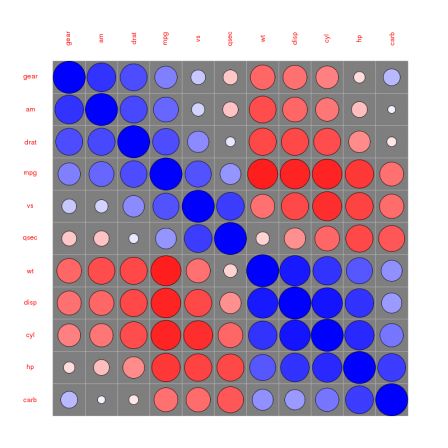
Taiyun Wei has updated RGG#152 with possibility to reorder the correlation matrix using PCA and choice of colors

graph_152__2.png

See Taiyun blog for a nice picasa animation

Sunday, March 15 2009

RGG#152: Correlation circles

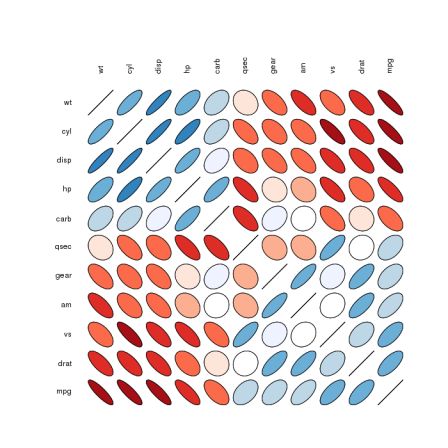
For those out there looking for yet another way to represent a correlation matrix, Taiyun Wei has submitted the correlation circles graph_152.png

Friday, February 6 2009

Tag cloud for the R Graph Gallery

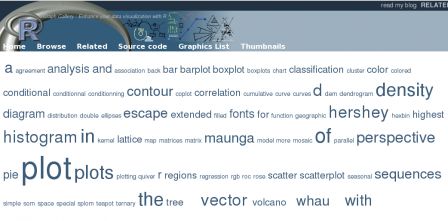
This post has a following goals: announcing the graph gallery has gained a tag cloud, and showing how it is done.
Screenshot.png

The cloud is a simple tag cloud of the words in titles of graphics that are included in the gallery. For this purpose, I am using an XML dump of the main table of the gallery database, here is for example the information for graph 12.

226     <graph>
227         <id>12</id>
228         <titre>Conditionning plots</titre>
229         <titre_fr>graphique conditionnel</titre_fr>
230         <comments>Conditioning plots</comments>
231         <comments_fr>graphique conditionnel</comments_fr>
232         <demo>graphics</demo>
233         <notemoy>0.56769596199524</notemoy>
234         <nbNote>421</nbNote>
235         <nbKeywords>0</nbKeywords>
236         <boolForum>0</boolForum>
237         <px_w>500</px_w>
238         <px_h>400</px_h>
239     </graph>
240     <graph>
We are interested in the tag titre of each tag graph. That is something straightforward to get with the R4X package (I will do a post specifically on R4X soon).
   1 x <- xmlTreeParse( "/tmp/rgraphgallery.xml" )$doc$children[[1]]
   2 titles <- x["graph/titre/#"] 
Next, we want to extract words of the titles, we need to be careful about removing &br; tags that appear in some of the titles and also remove any character that is not a letter or a space, and then seperate by spaces. For that, we will use the operators package like this :
4 words <- gsub( "<br>", " ", titles ) 
5 words <- words %-~% "[^[:alpha:][:space:]]" %/~% "[[:space:]]"
Next, we convert eveything to lower case, and extract the 100 most used words:
7 words <- casefold( words )
8 w100 <- tail( sort( table( words ) ), 100 )
9 
and finally generate the (fairly simple) html code:
10 w100 <- w100[ order( names( w100 ) ) ]
11 html <- sprintf( '
12 <a href="search.php?engine=RGG&q=%s">
13     <span style="font-size:%dpt">%s</span>
14 </a>
15 ', 
16     names(w100), 
17     round( 20*log(w100, base = 5) ), 
18     names(w100) )
19 cat( html, file = "cloud.html"  )
20 
and that's it. You can see it on the gallery frontpage Here is the full script:
   1 ### read the xml dump
   2 x <- xmlTreeParse( "rgraphgallery.xml" )$doc$children[[1]]
   3 
   4 ### extract the titles
   5 titles <- x["graph/titre/#"] 
   6 
   7 ### clean them up
   8 words <- gsub( "<br>", " ", titles ) 
   9 words <- words %-~% "[^[:alpha:][:space:]]" %/~% "[[:space:]]"
  10 
  11 ### get the 100 most used words
  12 words <- casefold( words )
  13 w100 <- tail( sort( table( words ) ), 100 )
  14 w100 <- w100[ order( names( w100 ) ) ]
  15 
  16 ### generate the html using sprintf
  17 html <- sprintf( '
  18 <a href="search.php?engine=RGG&q=%s">
  19     <span style="font-size:%dpt">%s</span>
  20 </a>
  21 ', 
  22     names(w100), 
  23     round( 20*log(w100, base = 5) ), 
  24     names(w100) )
  25 cat( html, file = "cloud.html"  )
  26 
  27 ### or using R4X again
  28 # - we need an enclosing tag for that
  29 # - note the &amp; instead of & to make the XML parser happy
  30 w <- names(w100)
  31 sizes <-  round( 20*log(w100, base = 5) )
  32 xhtml <- '##((xml
  33     <div id="cloud">
  34         <@i|100>
  35             <a href="search.php?q={ w[i] }&amp;engine=RGG">
  36                 <span style="font-size:{sizes[i]}pt" >{ w[i] }</span>
  37             </a>
  38         </@>
  39     </div>'##xml))
  40 html <- xml( xhtml )
  41 
Wednesday, February 4 2009

Graphic literacy improving? Let's try (RGG#150)

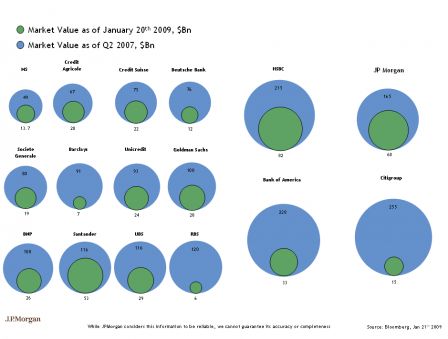
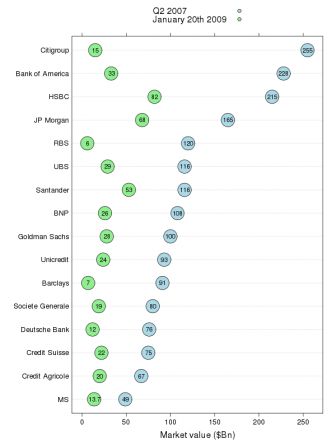
Here is a proposed alternative to this bubble inferno pointed out in the revolutions blog bubble.png ft.png and the R code behind it (here is the data). This is now item 150 in the graph gallery
   1 
   2 ### read the data
   3 d <- read.csv( "data.txt" )
   4 d$bank <- ordered( d$bank, levels = d$bank )
   5 
   6 ### load lattice and grid
   7 require( lattice )
   8 
   9 ### setup the key
  10 k <- simpleKey( c( "Q2 2007",  "January 20th 2009" ) )
  11 k$points$fill <- c("lightblue", "lightgreen")
  12 k$points$pch <- 21
  13 k$points$col <- "black"
  14 k$points$cex <- 1
  15 
  16 ### create the plot
  17 dotplot( bank ~ MV2007 + MV2009 , data = d, horiz = T, 
  18     par.settings = list( 
  19         superpose.symbol = list( 
  20             pch = 21, 
  21             fill = c( "lightblue", "lightgreen"), 
  22             cex = 4, 
  23             col = "black"  
  24         )
  25      ) , xlab = "Market value ($Bn)", key = k, 
  26      panel = function(x, y, ...){
  27        panel.dotplot( x, y, ... )
  28        grid.text( 
  29             unit( x, "native") , unit( y, "native") , 
  30             label = x, gp = gpar( cex = .7 ) )
  31      } ) 

Tuesday, February 3 2009

RGG#149: correlation ellipses

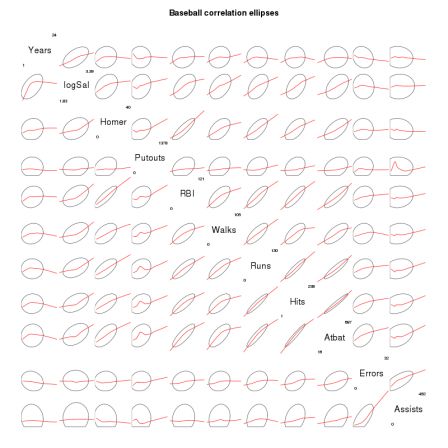
As suggested by Gregor Gorjanc, I've added the correlation ellipses graph from the plotcorr function of the ellipse package. graph_149.png

Monday, February 2 2009

RGG#147, RGG#148: correlation matrices gone wild

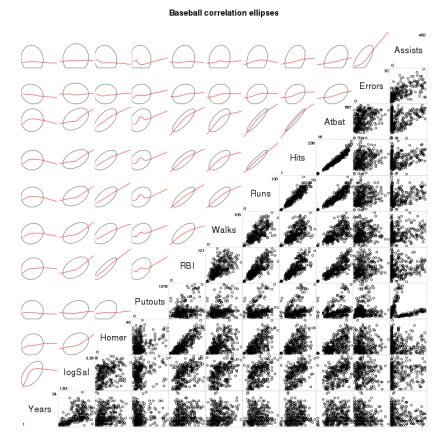
Thanks to Kevin Wright's corrgram package, here are two nex graphics for the graph gallery. graph_147.png graph_148.png

RGG#146: multipanel geographic lattice plot

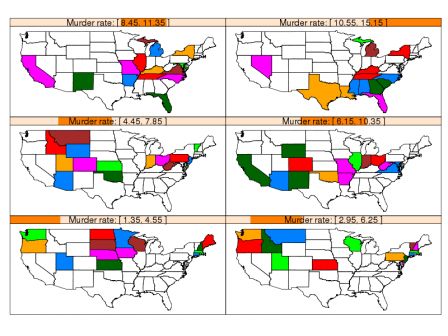
graph 146 from Karl Hufthammer has landed on r graph gallery. graph_146.png

RGG#145: image profiles by Detlev Reymann

I have just posted graph 145 into r graph gallery. Image Profiles by Detlev Reymann. graph_145.png

Friday, January 30 2009

graph 144 on graph gallery and plans for the future of the gallery

I've just uploaded graph 144 by Barry Rowlingson in the graph gallery. graph_144.png I has been a while since I last uploaded a graph in there, mainly because the process of adding a new graph is taking some time and is not that much automated. Many people have sent me suggestion graphics and eventually I will add them ... I promise. I have the intention of reworking the website so that it will be easier to maintain and other people can get involved, for that I will start by clean the php code behind it and release it into r-forge. For example, I'd like the process of adding a graph to be a bit more community driven instead of just being me selection graph that look good. watch this space.