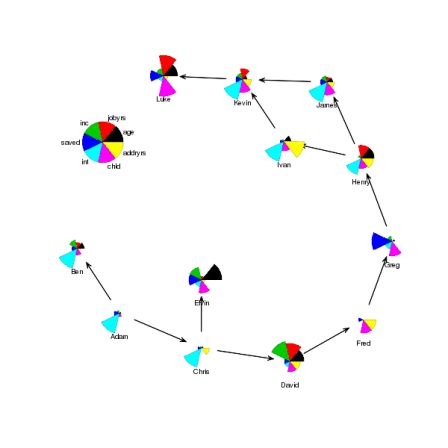
RGG#153: stars network
By romain francois on Friday, July 3 2009, 09:26 - Permalink
Graham Williams sent me this graph, now item 153 in the graph gallery.

This plot draws a network but at the nodes we have simple segment plots (and in general we might have any other kind of plot at the nodes). This code constructs a network (from the network package), plots it with the nodes being invisibly plotted (using plot.network from the sna package) and then overlays the segment plots using the star function (with the key being located at a position determined by largest.empty from the Hmisc package.